GEOS-5 Configuration for ARCTAS
The Arctic Research of the Composition of the Troposphere from Aircraft and Satellites (ARCTAS will take place during the Spring and Summer of 2008. This is a working document defining the main attributes of the GEOS-5 system that will be deployed in real-time in support of ARCTAS.
The ARCTAS Forecasting Support at GSFC page provides access to the main data products and web services.
The Baseline System

The starting point is the GEOS-5 Atmospheric Data Assimilation System (GEOS-5 ADAS) used for the Modern Era Retrospective-analysis for Research and Applications (MERRA), consisting of the main subsystems:
- GEOS-5 Atmospheric Global Climate Model (GEOS-AGCM)
- The Gridpoint Statistical Interpolation (GSI) analysis system, jointly developed by NOAA/NCEP and GMAO
This system will be complemented by the GEOS-5 Aerosol/Chemistry (AeroChem) components that were used in support of TC4 (Tropical Composition, Cloud and Climate Coupling) Mission, including
- Global CO and CO2 tracers
- GOCART aerosols:
- Dust: 5 bins
- Sea-salt: 5 bins
- Organic carbon: hydrophobic and hydrophilic tracers
- Black carbon: hydrophobic and hydrophilic tracers
- Sulfates: SO2, SO4, Dimethylsulphide (DMS) and Methanesulphonic acid (MSA)
Advection, diffusion, and convective transport of the above tracers are performed on-line within the GEOS-5 AGCM.
GEOS-5 Customization for ARCTAS

The baseline GEOS-5 system will include the following new features in support of ARCTAS:
- Additional tracers:
- 2 Hydrophilic Organic Carbon tag tracers driven by
- boreal biomass burning
- non-boreal biomass burning
- 5 CO tag tracers driven by
- boreal biomass burning
- non-boreal biomass burning
- non-biomass emissions: North America, Europe, Northern and Southern Asia
- 2 CFC F12 tracers tagged according to
- Tropospheric origin
- Stratospheric origin
- 2 Hydrophilic Organic Carbon tag tracers driven by
- The GEOS-5 File Specification Addendum for ARCTAS documents describes the additional data products being generated
- A real-time data delivery system consisting of
- OPeNDAP server
- Anonymous FTP
- Web Map Server (WMS) with GoogleEarth capabilities (TBD)
- On-line visualization system tailored for ARCTAS
- Web-based visualization of Chemical Weather
- WMS viewer
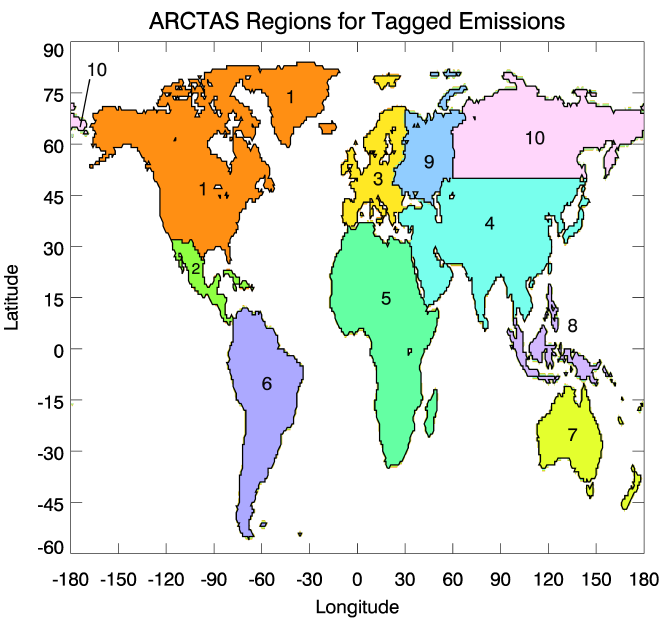
The bounding boxes for each of the regions above can be found in Table 1.
| Region | Label | Masking | Remarks |
|---|---|---|---|
| Boreal | bo | [45N,90N] | Tag: co_bbbo |
| Non-boreal | nb | [90S,45N) | Tag: co_bbnb |
| Northern Asia | ru | 10 | Tag: co_ffru |
| Southern Asian | as | 4 | Tag: co_ffas |
| Europe | eu | 3 | Tag: co_ffeu |
| North America | na | 1 | |
| Troposhere | tt | global | below GEOS-5 PV-based tropopause |
| Stratosphere | ss | global | above GEOS-5 PV-based tropopause |
Chemical Boundary Condition Datasets
CO Sources
CO emissions from fossil fuels are from a merge of several inventories. The emission files have been merged by Bryan Duncan using code and inventories provided by Bob Yantosca at Harvard University:
- Global emissions:
- Fossil fuel: 371.230 Tg
- Bio-fuel: 165.776 Tg
- EDGAR (2000) is the base global emissions for CO
- Note:: Base emissions are overwritten in regional areas with
             + EPA/NEI99     over continental USA (1999)
             + EMEP          over Europe (??)
             + BRAVO         over Northern Mexico (??)
             + David Streets over SE Asia & China (2000)
             + David Streets over China only (2001)
- no diurnal variation
- seasonal variation (+/- 10%) applied to N. America and Europe >36 N as described in Duncan et al. (2007),except for China as Streets provides monthly emissions"
CO biofuel emissions are from Yevich et al.[2003, Global Biogeochemical Cycles, 17 (4), 1095, doi:10.1029/2002GB001952]. To account for production of CO from co-emitted NMHC we apply scale factors to the direct emission sources from fossil fuels, biofuels, and biomass burning following Duncan et al. [2007, JGR, 112, D22301, doi:10.1029/2007JD008459]:
 co_ff = 1.20 * co_ff_inventory
 co_bf = 1.19 * co_bf_inventory
 co_bb = 1.11 * co_bb_inventory.
Isoprene and terpene emissions were calculated by the GMI combo model based on Guenther et al. [1995, JGR, 100 (D5), 8,873-8,892]], using GEOS-4 meteorological fields; the estimation of the production of CO from biogenic NMHC is described in Duncan et al. [2007]. A given CO source from the oxidation of biogenic methanol was distributed according to the emission of isoprene as described in Duncan et al. [2007]. CO produced from methane oxidation is accounted for by using the monthly CH4 fields and assuming a CO yield of 1. The monthly CH4 fields are based on the data from the NOAA GMD sites and distributed as a function of latitude [Bian et al., 2007].
- Fossil Fuel
- Biofuel
- Isoprene Emissions
- Methanol Emissions
- Terpene Emissions
- Methane (sfc)
- Methane (zonal average)
CO2 Emission Fluxes
CO2 emissions were compiled by Transcom 3 [Gurney et al., 2002].
CO2 fossil fuel is from Andres et al. [1996] and has a global total of 6.17 PgC/yr in 1995.
CO2 ecosystem productivity is from a seasonally balanced terrestrial biosphere based on computations of net primary productivity from the Carnegie-Ames-Stanford Approach (CASA) biogeochemical model [Randerson et al., 1997].
CO2 ocean exchange due to air-sea gas exchange has a magnitude of -2.2 PgC/yr from 1x1 monthly mean CO2 fluxes derived from sea-surface pCO2 measurements [Takahashi et al., 1999].