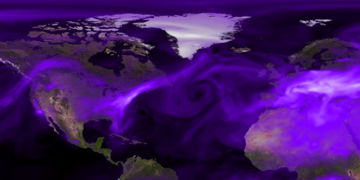
GEOS-5 Configuration for ARCTAS
The Arctic Research of the Composition of the Troposphere from Aircraft and Satellites (ARCTAS will take place during the Spring and Summer of 2008. This is a working document defining the main attributes of the GEOS-5 system that will be deployed in real-time in support of ARCTAS.
The Baseline System
The starting point is the GEOS-5 Atmospheric Data Assimilation System (GEOS-5 ADAS) used for the Modern Era Retrospective-analysis for Research and Applications (MERRA), consisting of the main subsystems:
- GEOS-5 Atmospheric Global Climate Model (GEOS-AGCM)
- The Gridpoint Statistical Interpolation (GSI) analysis system, jointly developed by NOAA/NCEP and GMAO
This system will be complemented by the GEOS-5 Aerosol/Chemistry (AeroChem) components that were used in support of TC4 (Tropical Composition, Cloud and Climate Coupling) Mission, including
- Global CO and CO2 tracers
- GOCART aerosols:
- Dust: 5 bins
- Sea-salt: 5 bins
- Organic carbon: hydrophobic and hydrophilic tracers
- Black carbon: hydrophobic and hydrophilic tracers
- Sulfates: SO2, SO4, Dimethylsulphide (DMS) and Methanesulphonic acid (MSA)
Advection, diffusion, and convective transport of the above tracers are performed on-line within the GEOS-5 AGCM.
GEOS-5 Customization for ARCTAS

The baseline GEOS-5 system will include the following new features in support of ARCTAS:
- Additional tracers:
- 2 Hydrophilic Organic Carbon tag tracers driven by
- boreal biomass burning
- non-boreal biomass burning
- 5 CO tag tracers driven by
- boreal biomass burning
- non-boreal biomass burning
- non-biomass emissions: North America, Europe and Asia
- 2 CFC F12 tracers tagged according to
- Tropospheric origin
- Stratospheric origin
- 2 Hydrophilic Organic Carbon tag tracers driven by
- The GEOS-5 File Specification Addendum for ARCTAS documents describes the additional data products being generated
- A real-time data delivery system consisting of
- OPeNDAP server
- Anonymous FTP
- Web Map Server (WMS) with GoogleEarth capabilities (TBD)
- On-line visualization system tailored for ARCTAS
- Web-based visualization of Chemical Weather
- WMS viewer
The bounding boxes for each of the regions above can be found in Table 1.
| Region | Longitude Range | Latitude Range | Remarks |
|---|---|---|---|
| Western Hemisphere | [180W,0] | [90S,90N] | |
| Eastern Hemisphere | [0,180E] | [90S,90N] | |
| Western Boreal | [180W,0] | [45N,90N] | |
| Eastern Boreal | [0,180E] | [45N,90N] | |
| Europe | TBD | TBD | |
| North America | TBD | TBD | |
| Troposhere | [180W,180E) | [90S,90N] | below GEOS-5 PV-based tropopause |
| Stratosphere | [180W,180E) | [90S,90N] | above GEOS-5 PV-based tropopause |
Chemical Boundary Condition Datasets
CO Sources
CO emissions from fossil fuels are from a merge of several inventories. The emission files have been merged by Bryan Duncan using code and inventories provided by Bob Yantosca at Harvard University:
- Global emissions:
- Fossil fuel: 371.230 Tg
- Bio-fuel: 165.776 Tg
- EDGAR (2000) is the base global emissions for CO
- Note:: Base emissions are overwritten in regional areas with
             + EPA/NEI99     over continental USA (1999)
             + EMEP          over Europe (??)
             + BRAVO         over Northern Mexico (??)
             + David Streets over SE Asia & China (2000)
             + David Streets over China only (2001)
- no diurnal variation
- seasonal variation (+/- 10%) applied to N. America and Europe >36 N as described in Duncan et al. (2007),except for China as Streets provides monthly emissions"
CO biofuel emissions are from Yevich et al.[2003, Global Biogeochemical Cycles, 17 (4), 1095, doi:10.1029/2002GB001952]. To account for production of CO from co-emitted NMHC we apply scale factors to the direct emission sources from fossil fuels, biofuels, and biomass burning following Duncan et al. [2007, JGR, 112, D22301, doi:10.1029/2007JD008459]:
 co_ff = 1.2 * co_ff_inventory; co_bf = 1.19 * co_bf_inventory
 co_bb = 1.11 * co_bb_inventory.
Isoprene and terpene emissions were calculated by the GMI combo model based on Guenther et al. [1995, JGR, 100 (D5), 8,873-8,892]], using GEOS-4 meteorological fields; the estimation of the production of CO from 'biogenic NMHC is described in Duncan et al. [2007]. A given CO source from the oxidation of biogenic methanol was distributed according to the emission of isoprene as described in Duncan et al. [2007]. CO produced from methane oxidation is accounted for by using the monthly CH4 fields and assuming a CO yield of 1. The monthly CH4 fields are based on the data from the NOAA GMD sites and distributed as a function of latitude [Bian et al., 2007].
- Fossil Fuel
- Biofuel
- Isoprene Emissions
- Methanol Emissions
- Terpene Emissions
- Methane (sfc)
- Methane (zonal average)
CO2 Emission Fluxes
CO2 emissions were compiled by Transcom 3 [Gurney et al., 2002].
CO2 fossil fuel is from Andres et al. [1996] and has a global total of 6.17 PgC/yr in 1995.
CO2 ecosystem productivity is from a seasonally balanced terrestrial biosphere based on computations of net primary productivity from the Carnegie-Ames-Stanford Approach (CASA) biogeochemical model [Randerson et al., 1997].
CO2 ocean exchange due to air-sea gas exchange has a magnitude of -2.2 PgC/yr from 1x1 monthly mean CO2 fluxes derived from sea-surface pCO2 measurements [Takahashi et al., 1999].