Recipe: Python program as OPeNDAP client
Back to G5NR Data Access Guide.
Problem
By accessing the collection inst01hr_3d_T_Cv via the OPeNDAP server
http://opendap.nccs.nasa.gov/dods/OSSE/G5NR/Ganymed/7km
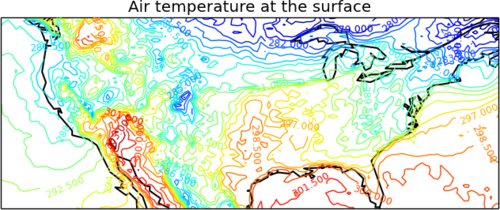
we want to read the surface temperature data inside the box bound by latitudes 25oN, 50oN and longitudes -130oW, -65oW for 2006/Sep/18, 9z, compute its min/max and plot the temperature data.
Solution
Here we use the netcdf4-python package. If the command
> python -c "import netCDF4"
does not return any error, we have the package installed.
Code
The code below reads the temperature data inside the box bounded by latitudes 25oN, 50oN and longitudes -130oN, -65oN, computes the maximum and minimum temperatures and plots (using the matplotlib package) the surface (level=71) temperature.
#!/usr/bin/env python

import sys
import numpy as np
import netCDF4 as nc4
import matplotlib.pyplot as plt

from mpl_toolkits.basemap import Basemap

rootgrp = nc4.Dataset('http://opendap.nccs.nasa.gov:9090/dods/OSSE/G5NR/Ganymed/7km/0.5000_deg/inst/inst01hr_3d_T_Cv', 'r')
print "rootgrp.variables['t'].shape", rootgrp.variables['t'].shape

# read subset of air temperature
print 'Reading T (subset)...',; sys.stdout.flush()
T = rootgrp.variables['t'][11771,:,229:280,99:230]
print 'done.'; sys.stdout.flush()
print 'T.shape:', T.shape

# max/min
print 'max(T): %.4f' % np.max(T)
print 'min(T): %.4f' % np.min(T)

# set up cylindrical map
m = Basemap(
    projection='cyl',
    llcrnrlat=25, urcrnrlat=50,
    llcrnrlon=-130, urcrnrlon=-65,
    resolution='c'
    )
m.drawcoastlines(linewidth=1.5)
m.drawmapboundary()

# plot contour
level = 71 # surface
X = np.arange(-130.0, -64.99, .5) # -65 is the last element
Y = np.arange(25.0, 50.01, .5) # 50 is the last element
cp = plt.contour(X, Y, T[level,:,:], 20, zorder=2)
plt.clabel(cp, inline=1, fontsize=9)
plt.title('Air temperature at the surface')
plt.show()
Output
Running this python script, we get the text output
rootgrp.variables['t'].shape (18288, 72, 361, 720)
Reading T (subset)... done.
T.shape: (72, 51, 131)
max(T): 305.6048
min(T): 191.6956
and the plot
Discussions
See Also
- File Spec: File:G5NR-Ganymed-7km FileSpec-ON6-V1.0.pdf
- Recipe: Python program to read data from downloaded file
