The September 2010 PIESA/Aerosol Experiments: Difference between revisions
| (32 intermediate revisions by 2 users not shown) | |||
| Line 1: | Line 1: | ||
{{rightTOC}} | {{rightTOC}} | ||
== Introduction == | == Introduction == | ||
This document is a summary of the GMAO Recovery Act Projects subtask ''Progress towards an Integrated Earth System Analysis''. | This document is a summary of the GMAO Recovery Act Projects subtask ''Progress towards an Integrated Earth System Analysis''. | ||
GMAO | GMAO staff, in collaboration with the Atmospheric Chemistry and Dynamics Branch at NASA/GSFC, conducted simulations of aerosol distributions in the atmosphere using the [http://geos5.org/wiki/index.php?title=GEOS-5_System_Overview GEOS-5] modeling and data assimilation system coupled with the GOCART aerosol module. Realistic transport of simulated aerosols was achieved by ingesting [http://gmao.gsfc.nasa.gov/merra/ Modern Era Retrospective-analysis for Research and Applications] (MERRA) meteorological fields (referred to as ''replay'' technique). | ||
== System Configuration == | == System Configuration == | ||
| Line 18: | Line 13: | ||
[[image: BB_freq-map.th_0.8.jas.png|thumb|Frequency of AOT_BB/AOT ratio exceeding 0.8 for JAS, 2004.]] | [[image: BB_freq-map.th_0.8.jas.png|thumb|Frequency of AOT_BB/AOT ratio exceeding 0.8 for JAS, 2004.]] | ||
[[image: QFED_MISR-minimization.global.th-0.5.2004_2006.png|thumb|GEOS5-QFED AOT and MISR AOT differences minimization.]] | [[image: QFED_MISR-minimization.global.th-0.5.2004_2006.png|thumb|GEOS5-QFED AOT and MISR AOT differences minimization.]] | ||
In order to further improve the GEOS-5 modeling capabilities and accelerate the transition of NASA satellite information into operational application, an improved biomass burning emissions dataset - Quick Fire Emission Dataset (QFED) was developed. QFED addresses some of the weaknesses of the Global Fire Emissions Database used in the base system configuration. Among the major limitations of the GFED emissions are the low spatial resolution ( | In order to further improve the GEOS-5 modeling capabilities and accelerate the transition of NASA satellite information into operational application, an improved biomass burning emissions dataset - [http://geos5.org/wiki/index.php?title=Quick_Fire_Emission_Dataset_%28QFED%29 Quick Fire Emission Dataset (QFED)] was developed. QFED addresses some of the weaknesses of the Global Fire Emissions Database used in the base system configuration. Among the major limitations of the GFED emissions are the low spatial resolution (1×1 degree) and temporal resolution (monthly). | ||
The | The QFED emissions are based on the ''top-down'' approach that uses the fact that the fire radiative power (FRP) at the top of the atmosphere is proportional to the rate of organic/vegetation mass that is burning. On the other hand, the emission of gasses and particulate matter released during burning is proportional to the consumed mass, hence the emissions rates are proportional to the measured FRP. | ||
The FRP needed to calculate the biomass burning emission was derived from the MODIS Thermal Anomalies/Fire products (MOD14, MYD14). The calibration of the QFED emissions was done individually for the MODIS/Terra and MODIS/Aqua data using the emissions factors from Andreae and Merlet [2001]. Our first step was to use global monthly mean GFED emissions to find individual global calibration factors for MODIS/Terra and MODIS/Aqua instruments. Using individual calibration factors has an advantage over using a single common factor for the two instruments, because one can account for the differences in the fire strengths at the local time of the satellite overpass, and ensures redundancy in case one of the satellites fails. The QFED fire emissions were used in the '''R_ddQFED''' experiment. The benefits of this calibration is that globally the QFED fire emissions are comparable to the commonly used GFED emissions, however they are available daily at finer horizontal resolution of 0.25×0.3125 degrees. | |||
Our | Our next objective was to produce more realistic fire emission magnitudes. As in-situ measurements of fire emissions are very limited, we relied instead on the fact that biomass burning can have significant contribution to the total aerosol loadings near active fires and downwind. Thus, one can use aerosol optical thickness (AOT) magnitude and relate it to the fire emission strength. | ||
Our approach was to find a global scale factor that minimizes the differences between the AOT retrieved by satellites and the modeled AOT which is equal to the sum of AOT due to biomass burning and AOT due to other type of aerosols. We constructed and performed two modeling runs - one with biomass burning (R_ddQFED) and another with no biomass burning (R_mmNOBB). From these two runs we calculated the contribution of the biomass burning to the total AOT and found the optimal value of the global scale factor that minimized the difference between the observed AOT and the modeled AOT. As a first approximation the same factor was used to scale the QFED emissions. The derived in this way globally scaled QFED emissions were used in the '''R_ddQFED_MISR''' experiment. | |||
( | Our observational AOT dataset was based on a 3-hourly globally gridded (2×2 degrees) [http://www-misr.jpl.nasa.gov MISR] AOT spanning the 2003-2009 period. The decision to use MISR retrievals was primarily dictated by the robustness of the MISR aerosol retrievals algorithm over land. | ||
== Overview of Experiments == | == Overview of Experiments == | ||
[http://geos5.org/wiki/index.php?title=Preliminary_Integrated_Earth_System_Analysis_%28PIESA%29 List of PIESA experiments.] | |||
== Results == | == Results == | ||
Comparison to MISR | ===Comparison to MISR=== | ||
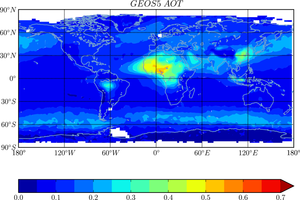
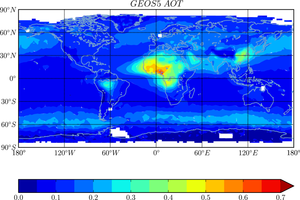
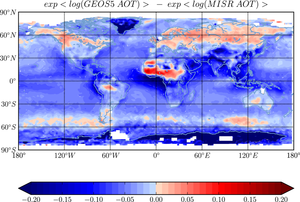
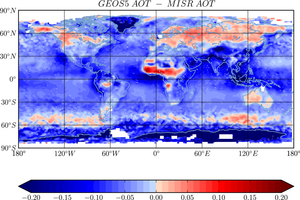
The GEOS-5/GOCART is able to successfully predict the large scale features of AOT over land and oceans. Compared to MISR, GEOS-5 exhibits regional AOT biases in some parts of the world. For example, over land the model has a small positive bias in Europe and North Asia, as well as positive bias in Sahara and Sahel. The model under-predicts the AOT in the Middle East and Central and East Asia arid regions. | |||
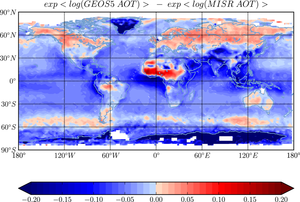
Using globally scaled QFED fire emissions in GEOS-5 has a positive impact on decreasing the differences between the modeled and MISR AOTs especially over the affected by frequent fires regions in South America and Africa. GEOS-5 AOT benefits greatly by the improved QFED emissions in Central Africa, where the tropical forests are a dominant biome type and fires are commonly observed. | |||
* Maps of time averaged (2004-2006) aerosol optical thickness (AOT) retreived from MISR(left) and simulated with GEOS-5/GOCART using GFED(center) and globally scaled QFED(right) biomass burning emissions. | |||
{| align="center" | |||
| [[Image:AOT-map.misr.tavg-2004_2006_3h.png |thumb|center|alt=MISR AOT. |MISR AOT.]] | |||
| [[Image:AOT-map.R_control.tavg-2004_2006_3h.png |thumb|center|alt=R_control (GEOS-5 with GFED fire emissions) AOT.|R_control AOT.]] | |||
| [[Image:AOT-map.R_ddQFED_MISR.tavg-2004_2006_3h.png|thumb|center|alt=R_ddQFED_MISR (GEOS-5 with globally scaled QFED fire emissions) AOT.|R_ddQFED_MISR AOT.]] | |||
|} | |||
* Maps of time averaged (2004-2006) AOT differences (GEOS-5 - MISR) using GFED (left) and globally scaled QFED(right) fire emissions. | |||
{| align="center" | |||
| [[Image:AOT-map.R_control-MISR.tmod-2004_2006_3h.png |thumb|center|alt=R_control - MISR, AOT.|R_control - MISR, AOT.]] | |||
| [[Image:AOT-map.R_ddQFED_MISR-MISR.tavg-2004_2006_3h.png|thumb|center|alt=R_ddQFED_MISR - MISR, AOT.|R_ddQFED_MISR - MISR, AOT.]] | |||
|} | |||
* Maps of GEOS-5 and MISR differences in terms of exp<log AOT> for the period 2004-2006 using GFED (left) and globally scaled QFED(right) fire emissions. | |||
{| align="center" | |||
| [[Image:AOT-map.R_control-MISR.tmod-2004_2006_3h.png |thumb|center|alt=R_control - MISR, AOT.|R_control - MISR, exp<log AOT>.]] | |||
| [[Image:AOT-map.R_ddQFED_MISR-MISR.tmod-2004_2006_3h.png|thumb|center|alt=R_ddQFED_MISR - MISR, AOT.|R_ddQFED_MISR - MISR, exp<log AOT>.]] | |||
|} | |||
<!-- ===Comparison to MODIS=== --> | |||
<!-- ===AERONET comparisons=== --> | |||
== Data Availability == | == Data Availability == | ||
Selected modeling experiments have been made available online. The download options include: | |||
* [ftp://iesa@ftp.nccs.nasa.gov/aerosol/experiments FTP server] | |||
* [http://opendap.gsfc.nasa.gov:9090/dods/IESA/aerosols OPeNDAP server] | |||
* [http://portal.nccs.nasa.gov/cgi-lats4d/opendap.cgi?&path=/IESA/aerosols/ Download Tool] | |||
== Acknowledgments == | == Acknowledgments == | ||
The ''Progress towards an Integrated Earth System Analysis'' task was supported under the GMAO's activities as part of the American Recovery and Reinvestment Act (ARRA) of 2009. | |||
(Thank our sponsors, including ARRA) | <!-- (Thank our sponsors, including ARRA): We would like to thank the ARRA Project for the financial support and to our Atmospheric Chemistry and Dynamics Branch at NASA/GSFC colleagues for their help and collaborative efforts. --> | ||
Latest revision as of 13:12, 6 October 2010
Introduction
This document is a summary of the GMAO Recovery Act Projects subtask Progress towards an Integrated Earth System Analysis.
GMAO staff, in collaboration with the Atmospheric Chemistry and Dynamics Branch at NASA/GSFC, conducted simulations of aerosol distributions in the atmosphere using the GEOS-5 modeling and data assimilation system coupled with the GOCART aerosol module. Realistic transport of simulated aerosols was achieved by ingesting Modern Era Retrospective-analysis for Research and Applications (MERRA) meteorological fields (referred to as replay technique).
System Configuration
The base system that was used to conduct multi-year (2003-2009) replay runs included GOCART aerosols (organic carbon, black carbon, sulfates, sea-salt, mineral dust), and global carbon monoxide (CO) and carbon dioxide (CO2) tracers. Sources of aerosols and chemical species were represented by time varying emission from anthropogenic, biogenic, biomass burning, volcanic, soil dust, ocean sources and oxidant fields. Detailed description of the GOCART aerosols and chemistry configuration can be found in the GEOS-5 GOCART Configuration for PIESA document.
The QFED Emissions
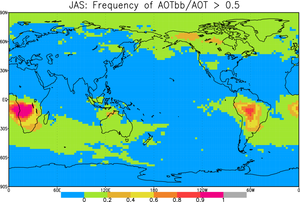
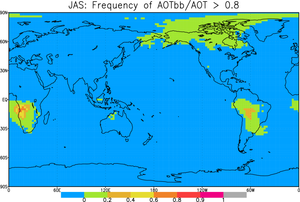
In order to further improve the GEOS-5 modeling capabilities and accelerate the transition of NASA satellite information into operational application, an improved biomass burning emissions dataset - Quick Fire Emission Dataset (QFED) was developed. QFED addresses some of the weaknesses of the Global Fire Emissions Database used in the base system configuration. Among the major limitations of the GFED emissions are the low spatial resolution (1×1 degree) and temporal resolution (monthly).
The QFED emissions are based on the top-down approach that uses the fact that the fire radiative power (FRP) at the top of the atmosphere is proportional to the rate of organic/vegetation mass that is burning. On the other hand, the emission of gasses and particulate matter released during burning is proportional to the consumed mass, hence the emissions rates are proportional to the measured FRP.
The FRP needed to calculate the biomass burning emission was derived from the MODIS Thermal Anomalies/Fire products (MOD14, MYD14). The calibration of the QFED emissions was done individually for the MODIS/Terra and MODIS/Aqua data using the emissions factors from Andreae and Merlet [2001]. Our first step was to use global monthly mean GFED emissions to find individual global calibration factors for MODIS/Terra and MODIS/Aqua instruments. Using individual calibration factors has an advantage over using a single common factor for the two instruments, because one can account for the differences in the fire strengths at the local time of the satellite overpass, and ensures redundancy in case one of the satellites fails. The QFED fire emissions were used in the R_ddQFED experiment. The benefits of this calibration is that globally the QFED fire emissions are comparable to the commonly used GFED emissions, however they are available daily at finer horizontal resolution of 0.25×0.3125 degrees.
Our next objective was to produce more realistic fire emission magnitudes. As in-situ measurements of fire emissions are very limited, we relied instead on the fact that biomass burning can have significant contribution to the total aerosol loadings near active fires and downwind. Thus, one can use aerosol optical thickness (AOT) magnitude and relate it to the fire emission strength.
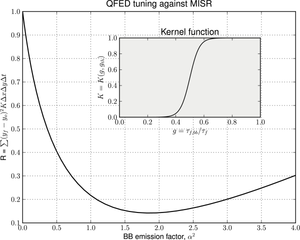
Our approach was to find a global scale factor that minimizes the differences between the AOT retrieved by satellites and the modeled AOT which is equal to the sum of AOT due to biomass burning and AOT due to other type of aerosols. We constructed and performed two modeling runs - one with biomass burning (R_ddQFED) and another with no biomass burning (R_mmNOBB). From these two runs we calculated the contribution of the biomass burning to the total AOT and found the optimal value of the global scale factor that minimized the difference between the observed AOT and the modeled AOT. As a first approximation the same factor was used to scale the QFED emissions. The derived in this way globally scaled QFED emissions were used in the R_ddQFED_MISR experiment.
Our observational AOT dataset was based on a 3-hourly globally gridded (2×2 degrees) MISR AOT spanning the 2003-2009 period. The decision to use MISR retrievals was primarily dictated by the robustness of the MISR aerosol retrievals algorithm over land.
Overview of Experiments
Results
Comparison to MISR
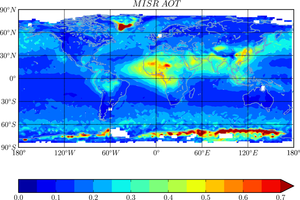
The GEOS-5/GOCART is able to successfully predict the large scale features of AOT over land and oceans. Compared to MISR, GEOS-5 exhibits regional AOT biases in some parts of the world. For example, over land the model has a small positive bias in Europe and North Asia, as well as positive bias in Sahara and Sahel. The model under-predicts the AOT in the Middle East and Central and East Asia arid regions.
Using globally scaled QFED fire emissions in GEOS-5 has a positive impact on decreasing the differences between the modeled and MISR AOTs especially over the affected by frequent fires regions in South America and Africa. GEOS-5 AOT benefits greatly by the improved QFED emissions in Central Africa, where the tropical forests are a dominant biome type and fires are commonly observed.
- Maps of time averaged (2004-2006) aerosol optical thickness (AOT) retreived from MISR(left) and simulated with GEOS-5/GOCART using GFED(center) and globally scaled QFED(right) biomass burning emissions.
 |
 |
 |
- Maps of time averaged (2004-2006) AOT differences (GEOS-5 - MISR) using GFED (left) and globally scaled QFED(right) fire emissions.
 |
 |
- Maps of GEOS-5 and MISR differences in terms of exp<log AOT> for the period 2004-2006 using GFED (left) and globally scaled QFED(right) fire emissions.
 |
 |
Data Availability
Selected modeling experiments have been made available online. The download options include:
Acknowledgments
The Progress towards an Integrated Earth System Analysis task was supported under the GMAO's activities as part of the American Recovery and Reinvestment Act (ARRA) of 2009.